Air Tracker shows pollution’s neighborhood path
-
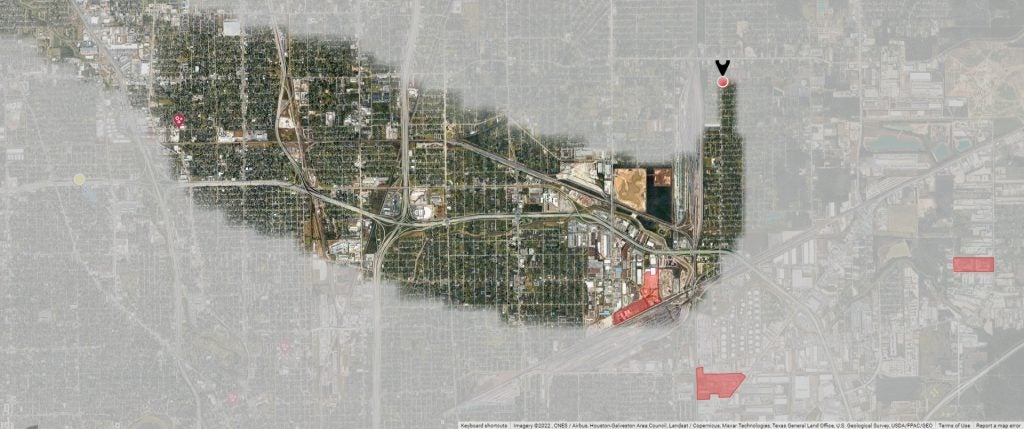 Air Tracker shows how emissions are most likely coming from an area to the south and west of the pin dropped on the map.
How local Houston sources impact neighborhood air
In Houston, the city’s lack of zoning coupled with historically discriminatory housing practices have placed many of its most vulnerable residents in the path of harmful pollution. And while communities now use improved air quality monitoring to show the impact of industrial polluters, they face the deep resistance to accountability. Air Tracker can help communities and local governments pinpoint potential sources of emissions, eliminating the finger pointing.
Residents of the Settegast neighborhood, for example, have long complained of heavy air pollution. As homes, churches and schools are nestled near a local railyard as well as other industrial sources, such as a steel fabricator, a metal recycler and nearby truck yards, identifying which business is the cause of pollution can be a challenge. However, using Air Tracker to look back over two recent days in May 2022: the 11th, and the 13th, the new regulatory monitor in the area, which often records PM2.5 levels that are much higher than other monitors around the city, we can see different industrial sources impacting pollution at different times. The tool points to source areas originating at areas in the west and southwest of the monitor from nearby railyards and mapped industrial locations.
By pulling in data from regulatory monitors–like Wayside–as well as low-cost sensors like Clarity monitors and Purple air, cities can gain a better sense of both the levels of pollution and which areas the sources of pollution are impacting most. Air Tracker can even allow users to create time-stamped maps to send to local government officials, showing them just how local pollution sources are impacting the air they breathe.