EDF’s new Air Tracker tool allows us to better understand how local air pollution behaves, illuminating the path it takes from a likely source area. Because this tool allows us to look backwards at where pollution likely originated, it shifts the focus, putting communities and people first. Developing it required a shift in thinking.
Most atmospheric scientists focus on particle and air movement to help us predict what’s going to happen in the future. As a scientist working in air pollution, I wanted to use those same principles to look backwards so I could better understand how the emissions upwind of us mix and travel through the air, providing a better picture of what we’re breathing at any given time. This way, we don’t have to model every single source to know what’s important to who and when.
When I joined EDF in 2019, our scientists had already successfully shown how mobile air monitoring programs could highlight dramatic differences in pollution levels within individual city blocks. We wanted to go beyond showing the presence of pollution–and illustrate how it traveled to get there.
EDF and academia joined forces to leverage cutting edge insights.
To do this, we enlisted the help of John C. Lin, an atmospheric scientist from the University of Utah who developed the STILT model (which has since been incorporated into NOAA’s HYSPLIT model). He and his team were already working with our partners at Google Earth Outreach on a source apportionment project. We also tapped Paul Dille (who pulled in Randy Sargent and Amy Gottsegen) from CREATE Lab at Carnegie Mellon University, whose Smell PGH application allows users to better understand the pollution landscape in Allegheny County, PA. EDF colleagues Alex Franco, Mindi DePaola and Grace Tee Lewis provided invaluable insight and help as well.
Air Tracker runs on real-time, trusted, scientific models coupled with air pollution and weather data to help residents, scientists and cities learn more about the air they’re breathing. While Air Tracker is currently mapping fine particle pollution trajectories in Houston, Salt Lake City and Pittsburgh, we designed it to work with other primary pollutants anywhere in the world.
Filling current air monitoring gaps
Despite advances in low-cost mobile and stationary monitoring networks, existing air pollution tracking is still lacking. Currently designed to provide us with a solid understanding of background air pollution, the federal and state government system of monitors essentially smudges out the rough edges to create averages, which underemphasizes the very real, very harmful pollution burden many urban–often historically vulnerable–communities face.
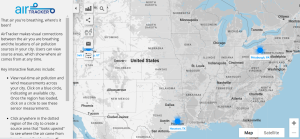
Air Tracker can help counter that averaging effect. It allows users to click anywhere within their city map to see the most likely source area of the air they’re breathing at any given time.
Beyond the mapping application, it can improve air quality efforts in the following ways:
- Placement of new monitors and networks
For communities that have long suspected they’ve been subjected to dirty air, Air Tracker can help them show that their air is influenced by nearby facilities. This can help them place monitors in specific locations to show just how much pollution they face and when it’s at its worst.
Cities wanting to get serious about air quality can also use the tool to design either stationary or mobile monitoring efforts. It can also help them answer questions about specific facilities that are known emitters, while spotting ones that may not have been on their radar.
- Hold polluters accountable
Even in cities like Houston–where a lack of zoning has allowed industry to flourish unchecked, putting homes, schools and entire communities in the path of harmful pollution–it can be hard to pinpoint which facilities are most likely responsible for localized emissions. The models behind AIr Tracker’s source area development use wind and weather data to illuminate which pollution sources are the most likely culprits, giving regulators a powerful enforcement tool.
- Putting communities and people first
Because Air Tracker can look backwards at pollution’s path, we can start with communities and people first when seeking to map exposure and its impacts. This can help correct for the current distortion of our current air pollution monitoring system, which wrongly assumes all people are exposed equally.
We know communities face an unequal burden from air pollution. Our hope is that Air Tracker will allow us to better capture and highlight those discrepancies so the people living there can get the relief they need and deserve. Read more about the methodology here.