Greg Slater, Senior Data Analyst, and Oliver Lord, Head of Policy and Campaigns
The pollution and health impacts from London’s busiest roads – the Red Routes – go far beyond the streets themselves.
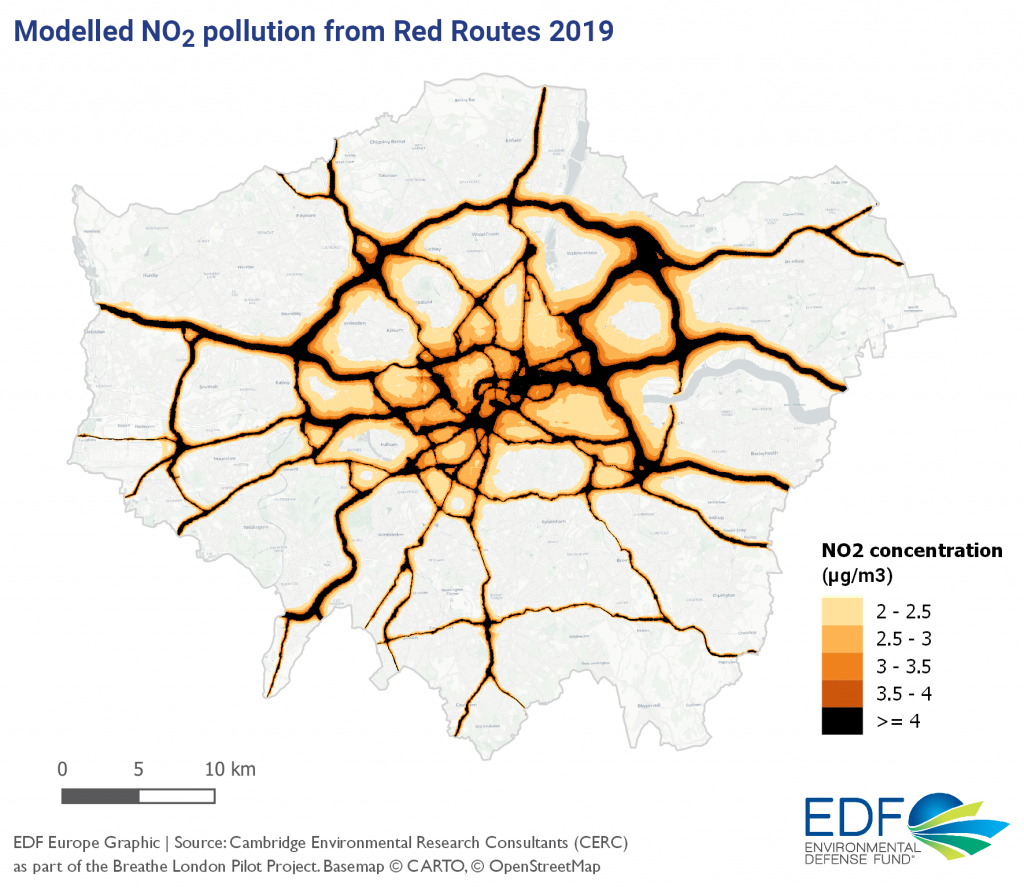
As a result of the nitrogen dioxide (NO2) that comes solely from vehicle pollution on the Red Routes, our new analysis estimates 9% of the city’s children may be living in an area where they are at a significantly higher risk of developing asthma. The analysis shows the area of increased asthma risk from Red Route pollution is seven times the size of the roads themselves.
Londoners don’t have to live directly on the major roads to experience the increased risk from their pollution. The capital needs a new vision for the city’s most polluted roads, including a comprehensive traffic-reduction plan that reduces health inequities.
Transport pollution and asthma
Our previous analysis shows how the Red Routes have far higher levels of NO2 pollution than the average thoroughfare.
To examine this in more detail and shed light on the health burden for local communities, we looked at a new modelled dataset produced by Cambridge Environmental Research Consultants (CERC) as part of the Breathe London pilot project that isolates the vehicle NO2 pollution from the Red Routes and shows where this pollution travels in the air.
In recent years, there has been building evidence of an association between exposure to traffic-related air pollution and the development of childhood asthma. In their review of research into this topic, Khreis et al (2017) found that the risk of new paediatric asthma cases increased by 5% with every 4 µg/m3 of NO2 air pollution.
We applied these findings to the modelled dataset of Red Route pollution and found levels of 4 µg/m3 NO2 and higher – just from the Red Routes – covers an area seven times bigger than that of the roads themselves. The map below displays in black where the Red Routes alone are adding at least 4 µg/m3 of extra NO2 pollution, which could increase the risk of children developing asthma by at least 5%.
We estimate 9% of London children live in the area with at least 4 µg/m3 of extra NO2 pollution from the Red Routes. Our estimates indicate these children have a significantly increased risk of developing asthma unless action is taken to reduce vehicle-related pollution on the Red Routes. This is in addition to existing asthma cases, which can be aggravated by elevated pollution levels. The map also shows levels of NO2 at or greater than 2 µg/m3, which can carry health risks as well.
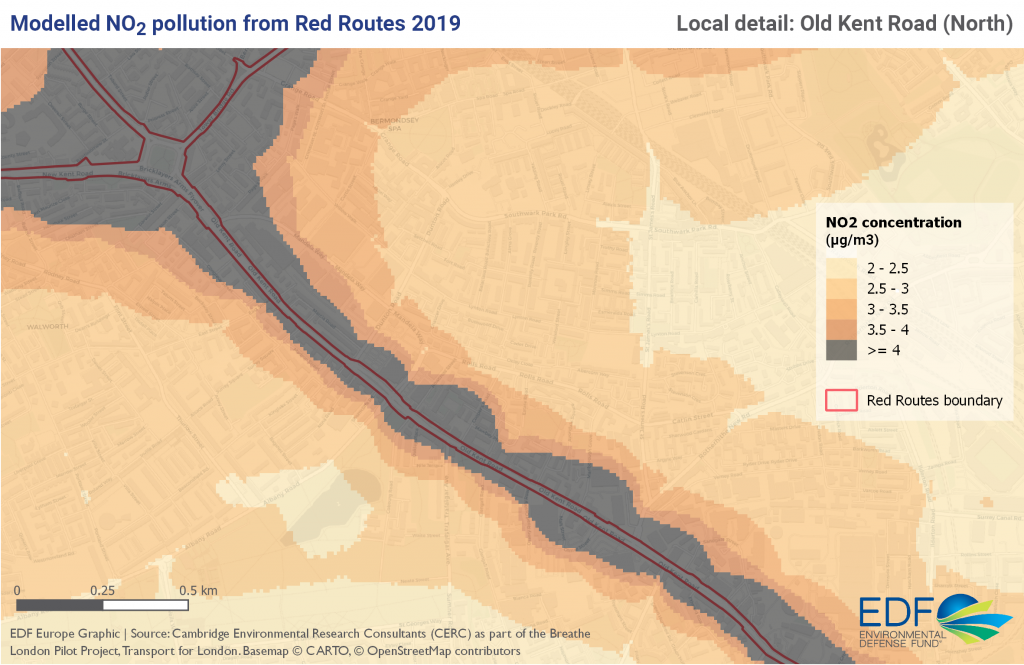
Zooming in to a more local level, the map below shows the north section of the Red Route Old Kent Road and the surrounding area. The colours demonstrate how the pollution spreads beyond the road boundaries, with dark grey representing at least 4 µg/m3 of NO2 pollution from the Red Routes. Here we see the model suggests areas close to the road are all in dark grey. Residential areas much further away are also affected by Red Route pollution.
And that’s just a small slice of air pollution that London children are likely exposed to. We have looked at the Red Routes in isolation to demonstrate how pollution from major roads travels in the city. However, there are of course other roads and pollution sources, as well as air pollutants associated with traffic emissions like fine particulate matter (PM2.5) that must also be accounted for a complete picture of the health impacts.
London needs action now to protect young lungs. The next Mayor of London should commit to a bold vision and urgent action plan to address the volume of vehicles on the Red Routes and to assess if the network is still fit for purpose.
Please see here for the methods behind this data analysis.
Further detail on the health impacts of the Red Routes can be found in our paper with Centric Lab, Rethinking London’s Red Routes: From red to green. You can also watch a relevant discussion here, which took place at a Centre for London webinar with health and transport experts.


