What’s new: EDF and partners have just published new research that explores how novel data sources, including satellites and computer models, can help improve our ability to map, identify, track and reduce disparities in air pollution exposure and health impacts.
What we know: Air pollution in the United States has declined dramatically over the last several decades, thanks to strong, protective clean air policies. And yet, unjust disparities in pollution exposure remain, with people of color in the United States burdened by higher levels of health-harming pollution than white people, regardless of income. One root cause of this pollution inequity is historic disinvestment in communities of color through racist policies like redlining, along with discriminatory siting of highways and polluting industrial facilities.
Levels of nitrogen dioxide (NO2), a key health-harming pollutant emitted by trucks, cars and industrial facilities, can vary substantially at fine spatial scales – even from one end of a block to the other. For example, an EDF study in West Oakland, California found that NO2 levels could be up to four times higher in areas of the neighborhood close to truck traffic and other pollution sources.
Research and policy decision-making has historically relied on NO2 measurements from government regulatory monitors—complex and expensive stationary instruments that must meet rigorous standards. Data from these monitors helps the Environmental Protection Agency (EPA) identify areas where air pollution levels exceed Clean Air Act health standards and guides actions to reduce pollution. However, given how much NO2 concentrations can vary across small distances, it is unlikely we will ever deploy enough of these monitors to enable a full understanding of exposure disparities that exist between population groups.
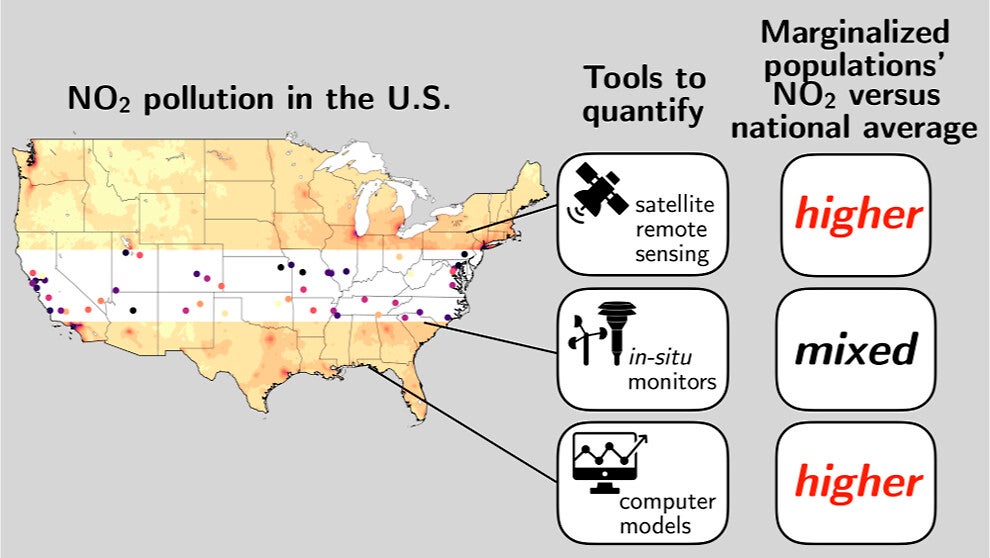
What this research adds: New datasets, including satellite data, statistical models and photochemical models, can estimate NO2 at a relatively high spatial resolution and across the entire United States. Our new research compared estimates of NO2 levels and racial/ethnic exposure disparities using these novel data sources to estimates based on traditional data from the US EPA regulatory monitoring network.
The new NO2 data sources showed that Black, Hispanic, Asian and multiracial Americans experienced average NO2 levels that were 15-50% higher than those experienced by the US population in 2019. Meanwhile, the non-Hispanic white population experienced levels that were 5-15% lower. In contrast, data from the regulatory monitors indicated more moderate patterns of racial/ethnic disparities, suggesting that the regulatory network does not currently provide a full understanding of inequity in pollution exposure.
NO2
|
How it can contribute to better policies and enforcement |
| Regulatory Monitors | • Monitoring attainment of National Ambient Air Quality Standards • Ground-truthing satellite and model datasets |
| Satellites | • Guiding placement of future regulatory monitors or measurement campaigns • Identifying potential pollution |
| Photochemical and statistical models | • Tracking and reporting trends over time in pollution disparities • Estimating NO2-attributable disease burdens and associated disparities • Quantifying source sector contributions to ambient NO2 (Photochemical models) |
Moving forward: This research demonstrates that policymakers and regulators will need to incorporate new sources of data beyond the existing regulatory monitoring network to accurately understand which policies are or could be most effective in helping close the racial-ethnic gap in air pollution exposure.
The table above outlines how satellite and modeling data can complement existing sources. Satellite data can be leveraged to identify pollution hotspots currently not measured by regulatory monitors, which could guide placement of new government monitors and investigations of potential emissions sources. Air pollution models can enable tracking and reporting of pollution disparity trends over time and make it easier to quantify health impacts.
Integrating these new data sources into regulatory decision-making would improve the coverage of the regulatory monitoring network, enable a more complete understanding of inequities in air pollution exposure and inform policies aimed at mitigating this environmental injustice.
Maria Harris in a Senior Scientist at Environmental Defense Fund. Learn more about her work here.
*Table adapted from Table 1 in Kerr et al. 2023